Vulnerable Groups – Concept & Notes PDF
Topic covered: Vulnerable Groups and MCQs Questions: Poverty as a Challenge (All single detail notes are exam-oriented).
We have discussed in-depth and exam-oriented pointers that can be asked in the board exam of class 9th about the “Vulnerable Groups“ from the NCERT Economics notes for class 9th chapter 3 Poverty as a Challenge.
Download the NCERT Economics for Class 9th Chapter 3 Poverty as a Challenge Notes PDF
Chapter 3: Poverty as a Challenge in Class 9 Economics deals with one of the most pressing social issues in India. The chapter explains how poverty is measured, its causes, and the everyday struggles faced by poor households. Many students often find the terms like “social exclusion” or “vulnerability” tricky, so these notes break them down with examples that are easy to follow. You’ll also get a clear picture of government schemes and policies aimed at reducing poverty. Download the NCERT Economics for Class 9th Chapter 3 Poverty as a Challenge Notes PDF to revise key points quickly and confidently.
Vulnerable Groups
1. General Pattern:
- Poverty is not equally distributed among all social groups and economic categories.
- Certain groups are more vulnerable than others.
2. Most Vulnerable Social Groups:
- Scheduled Castes (SC) households.
- Scheduled Tribes (ST) households.
3. Most Vulnerable Economic Groups:
- Rural agricultural labour households.
- Urban casual labour households.
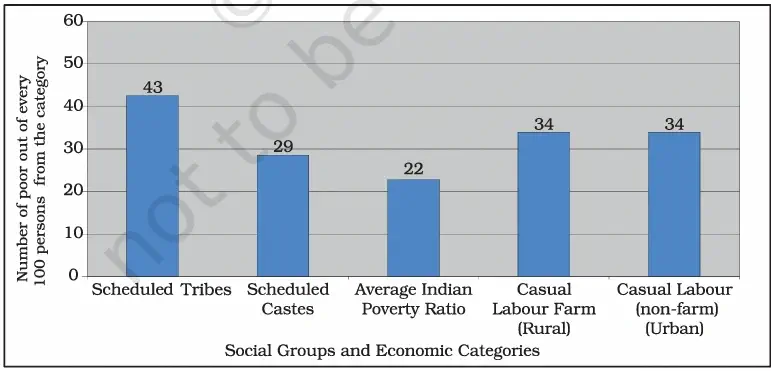
4. Poverty Percentages (Graph 3.2 Data):
- National Average (All Groups): 22% below poverty line.
- Scheduled Tribes (ST): 43% below poverty line (highest).
- Urban casual workers: 34% below poverty line.
- Rural casual farm labourers: 34% below poverty line.
- Scheduled Castes (SC): 29% below poverty line.
5. Double Disadvantage:
- Landless casual wage labourers belonging to SC or ST groups face the worst poverty conditions.
6. Trends in Poverty Decline (1990s):
- Decline seen among:
a. Scheduled Castes (SC).
b. Rural agricultural labourers.
c. Urban casual labourers. - Exception: Scheduled Tribes (ST) – no significant poverty decline.
7. Intra-Family Inequality:
- Even within poor families, inequality exists.
- Most affected groups inside families:
a. Women.
b. Elderly people.
c. Female infants (often denied equal access to resources).
8. Exam Tip:
- 43% – Scheduled Tribes (highest poverty).
- 34% – Rural casual labour & Urban casual workers.
- 29% – Scheduled Castes.
- 22% – National average.
- Remember double disadvantage = landless + SC/ST.
Next & Previous Topics of NCERT/CBSE Economics Class 9 Chapter 3: Poverty as a Challenge
MCQs on NCERT Economics Class 9 Chapter 3 Topic – Vulnerable Groups
Here are the top exam-oriented MCQ-type questions on “Vulnerable Groups” that you should prepare for your CBSE or state board exams:
Question 1. The proportion of people below the poverty line is:
a) The same for all social groups
b) The same for all economic groups
c) Different across social and economic groups
d) Only higher in urban areas
Answer: c)Different across social and economic groups
Question 2. Which social groups are most vulnerable to poverty in India?
a) Other Backward Classes (OBCs)
b) Scheduled Castes and Scheduled Tribes
c) Urban middle-class families
d) Industrial workers
Answer: b) Scheduled Castes and Scheduled Tribes
Question 3. Among economic groups, the most vulnerable to poverty are:
a) Rural small farmers and urban salaried employees
b) Rural agricultural labourers and urban casual labourers
c) Industrial labourers and self-employed people
d) Shopkeepers and traders
Answer: b) Rural agricultural labourers and urban casual labourers
Question 4. The average percentage of people below the poverty line in India is:
a) 34%
b) 43%
c) 22%
d) 29%
Answer: c) 22%
Question 5. Which group has the highest poverty ratio in India?
a) Scheduled Castes
b) Rural agricultural labourers
c) Urban casual labourers
d) Scheduled Tribes
Answer: d) Scheduled Tribes
Question 6. About how many out of 100 people belonging to Scheduled Tribes are unable to meet basic needs?
a) 22
b) 34
c) 29
d) 43
Answer: d) 43
Question 7. The percentage of urban casual workers below the poverty line is around:
a) 22%
b) 34%
c) 43%
d) 29%
Answer: b) 34%
Question 8. The percentage of rural casual farm labourers living in poverty is:
a) 22%
b) 29%
c) 34%
d) 43%
Answer: c) 34%
Question 9. The proportion of Scheduled Castes below poverty line is approximately:
a) 22%
b) 29%
c) 34%
d) 43%
Answer: b) 29%
Question 10. The double disadvantage of poverty refers to:
a) Urban-rural income inequality
b) Landless casual wage labour in socially disadvantaged groups
c) High education cost and low income
d) Agricultural vs industrial income gaps
Answer: b) Landless casual wage labour in socially disadvantaged groups
Question 11. During the 1990s, which group did not see a decline in poverty?
a) Scheduled Castes
b) Rural agricultural labourers
c) Urban casual labour households
d) Scheduled Tribes
Answer: d) Scheduled Tribes
Question 12. Apart from social groups, inequality of income also exists within:
a) States
b) Urban and rural regions
c) Families
d) Castes
Answer: c) Families
Question 13. Within poor families, who often suffer more from inequality of resources?
a) Men and young boys
b) Women, elderly people and female infants
c) Traders and businessmen
d) Educated family members
Answer: b) Women, elderly people and female infants